A mind map displays the pictorial representation of a business asset and its association with other business and technical assets. Technical assets refer to systems, environments, tables, and columns. Business assets refer to business terms, business policies, business rules, and other business assets as defined in the Business Glossary Manager Settings. You can also generate mind map for multiple business assets at the catalog level.
You can view and analyze Mind Maps in following views:
-
Logical View
-
Conceptual View
To view mind maps, follow these steps:
- In the <Business_Asset> Summary section, do one of the following:
Select multiple business assets and click
 to view a mind map for the selected assets.
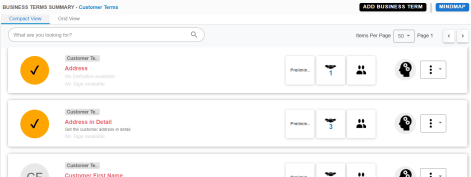
Click
 for an asset to view mind map for that asset alone.
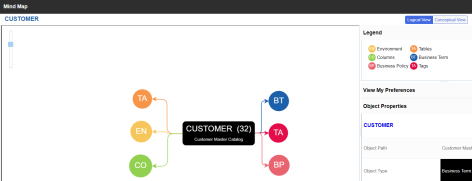
The Mind Map page appears and the Logical View opens by default.
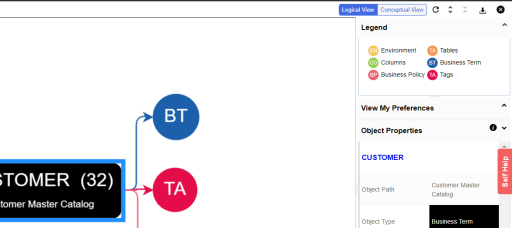
- On the Mind Map page, you can click Logical View or Conceptual View to switch between them:
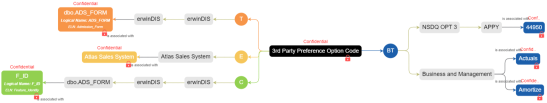
Logical View: The logical view displays the associated technical assets on the left side and associated business assets on the right of the business asset. Selecting an asset on the mind map displays its properties in the Object Properties pane.
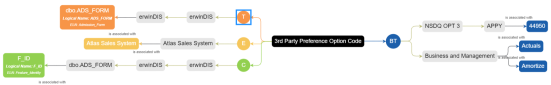
Conceptual View: The conceptual view displays the associated technical assets in non-hierarchical representation. Selecting an asset on the mind map displays its properties in the Object Properties pane.

- Use the following options to work on the mind map:
- Reload Diagram (
 )
)- Use this option to reload the mind map to its default appearance.
- Expand Diagram (
 )
)- Use this option to expand the mind map to view the associated technical and business assets.
- Reset Diagram to Original View (
 )
)- Use this option to collapse the expanded nodes and restore the mind map to its original form.
- Export (
 )
)- Use this option to export the mind map. Hover over Export and use the following options:
- Mind Map - Excel Report: Use this option to download the mind map in the .xlsx format. Ensure that you expand the mind map before downloading the report.
- Mind Map - Image: Use this option to download the mind map as an image, in the .jpg format. Ensure that you expand the mind map before downloading the mind map image.
- Sensitivity Details - Excel Report: Use this option to download the sensitivity report of all associated assets in the .xlsx format. This report includes sensitive data indicator (SDI), SDI classification, and SDI description of the associated assets.
- Reload Diagram (
- Assets
- Use the Include Assets without Associations to display business assets with no associations.
This option is only available when you generate mind maps for multiple assets at the same time.
- Qualifier
- Use the Show Qualified View to display business asset and its association with other business and technical assets that are created using a unique qualifier (business asset). For more information about creating associations using a qualifier, refer to the Setting Up Associations Using Qualifiers topic.
- Asset Hierarchy
- Use the following options to view asset hierarchy:
- Gray Background: Use this option to display gray colored background for the asset hierarchy nodes. For example, the following mind map displays nodes in the hierarchy with a gray-colored background.
This option is only available for Logical View.
- Show Asset Hierarchy/Show Hierarchy: Use this option to view hierarchy of all the assets in a mind map.
- Gray Background: Use this option to display gray colored background for the asset hierarchy nodes. For example, the following mind map displays nodes in the hierarchy with a gray-colored background.
You can use the following panes to view properties and configure preferences for the mind map:
Legend
Use legends to identify objects on the mind map.
View My Preferences
You can set your preferences to view the mind map according to your requirements. The available settings differ based on the logical and conceptual view. Expand the View My Preferences pane and use the following options:
- Association Statistics
- Use the Show Counts option to view the number of associations for a business asset.
- Relationship Options
- Use the following options to configure relationship options:
- Include Relationships: Use this option to display relationships between the assets on the mind map.
- Switch to Enterprise Relationship configuration: Use this option to apply the selected line color and type configured in the Business Glossary Manager Settings.
For example, in the following mind map, the relationship (is associated with) and the line color as set in Business Glossary Manager Settings appear on the mind map.
- View Logical Names
- Use the following options to view logical and expanded logical names of tables and columns on the mind map:
- Logical Names: Use this option to view the logical names of tables and columns on the mind map.
- Expanded Logical Names: Use this option to view the expanded logical names of tables and columns on the mind map.
You can configure logical names and expanded logical names of tables and columns in the Metadata Manager.
For example, the following mind map displays logical names and expanded logical names.

- View Sensitivity
- Use the following options to view sensitivity information of the assets on the mind map:
- Sensitivity Data Indicator(Y/N): Use this option to indicate whether an asset is classified as sensitive.
- Sensitive Data Classification: Use this option to view the sensitivity classification of assets.
For example, the following mind map displays the sensitive data indicator (
 ) for assets that are classified sensitive.
For more information on updating asset sensitivity in mind maps, refer to the Updating Sensitivity topic.
- Filters
- Use the following filter options to select information availability on mind maps:
- By Asset Type: Use this option to filter and display required asset types on the mind map.
- By Relationship: Use this option to filter and display required assets on the mind map based on relationships.
For example, in the By Asset Type list, select Column and in the By Relationship list select is associated with. Doing this displays only those columns that have the is associated type of relationship with the asset.

Object Properties
Expand the Object Properties pane to view the selected asset's information, such as its path, type, association statistics, data governance responsibilities, and sensitivity classification of an asset.
Overview
Expand this pane to open a panned view of the mind map. You can drag the purple box to move across the mind map and focus on specific areas. 
|
|
|
Copyright © 2021 erwin, Inc. All rights reserved. Copyright © 2021 Quest Software Inc. All rights reserved. All trademarks, trade names, service marks, and logos referenced herein belong to their respective companies. |